Loading...

United States (US) health

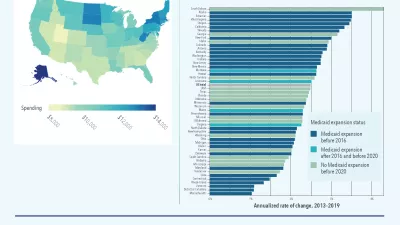
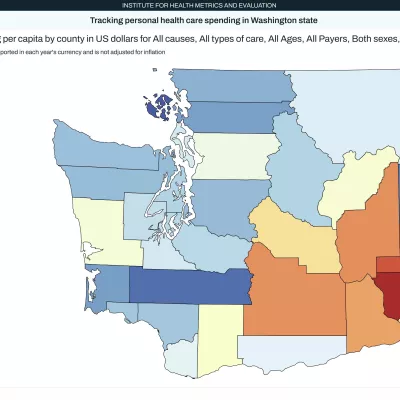
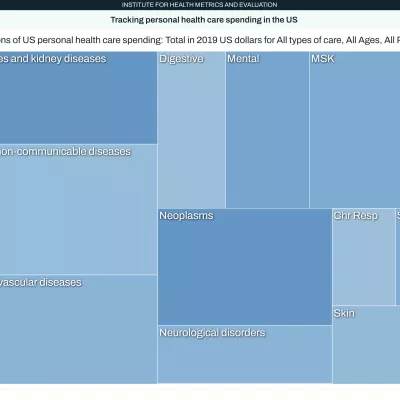
About $4.3 trillion of the $10 trillion spent on health globally is in the US. Despite this huge investment, there are still wide disparities in health and health spending across the country. 
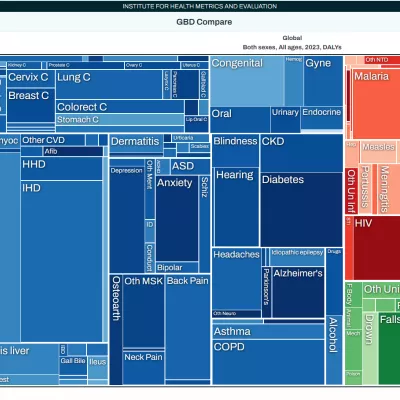
1.2 million deaths in 2023 were due to only five leading causes: Ischemic heart disease, Alzheimer's disease, stroke, chronic obstructive pulmonary disease, and lung cancer.
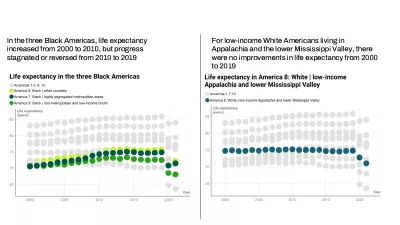
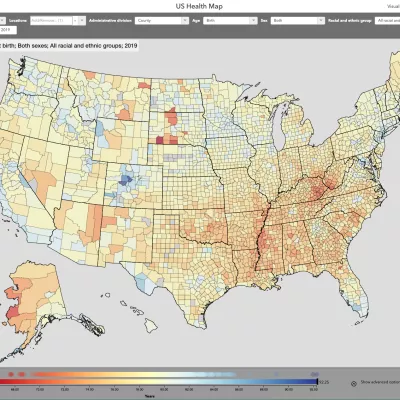
78.5 years was the life expectancy at birth in 2023 in the US, compared to 76.5 in 2021, the height of the COVID-19 pandemic.
468,000 deaths were attributable to high blood pressure in 2023.

Key finding

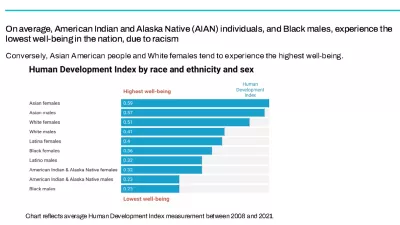
In this study of the USA, we aimed to adapt the Human Development Index (HDI) framework to measure the HDI at an individual level to examine disparities in the distribution of wellbeing by race and ethnicity, sex, age, and geographical location.

Proportion of population in lowest HDI deciles by Public Use Microdata Areas (PUMA)-counties 2012–2021

Infographics

Infographic

Which US counties and states have the best health care?

In a new study published in The Lancet Public Health, researchers at the Institute for Health Metrics and Evaluation (IHME) examined which counties performed highest on the Triple Aim, a framework that includes positive patient experience, low health care spending per person, and good health outcomes.

Infographic

Air pollution’s link to dementia

The Institute for Health Metrics and Evaluation (IHME) carried out the largest-ever study synthesizing evidence of air pollution and dementia.

Infographic

Well-being in the US

A new analysis reveals stark disparities within the United States and highlights the urgency of tackling deeply rooted structural inequalities through social programs.

Infographic

Dramatic differences in health care spending

The gap between the US states that spend the most and least on health is wide, and varied growth rates mean that the gap between those who spend the most and the least is only increasing. More than 45% of the differences in health spending can be explained by income and regional prices, but much of the variation remains unexplained.

Interactive data visuals

Interactive Data Visual

GBD Compare

Analyze updated data about the world’s health levels and trends from 1990 to 2023 from the Global Burden of Disease (GBD) study.

Interactive Data Visual

US Health Map

Explore health trends in the United States by race and ethnicity for all-cause mortality and life expectancy.

Download US health data

Find all US health data sources and estimates for download in our data catalogue, the Global Health Data Exchange (GHDx).

Health profiles

Country profiles

Health research by location

Get an overview of population health and demographic information for every country of the world.

Health by location

US County Profiles, 2016

US county profiles highlighting performance of each county in terms of mortality rates for select causes, life expectancy at birth, and prevalence of select risk factors.